Follow us on Social Media


VISIBILITY • ANALYTICS • INSIGHTS • GROWTH
SQL Business Intelligent
(B.I) Dashboard
Instant Insights with
Turn business data into a real-time performance overview in one screen. Track sales, analyze trends, and evaluate staff contribution with visual reports, while combining multiple data sources into a single Business Intelligence dashboard.
What is SQL B.I Dashboard?
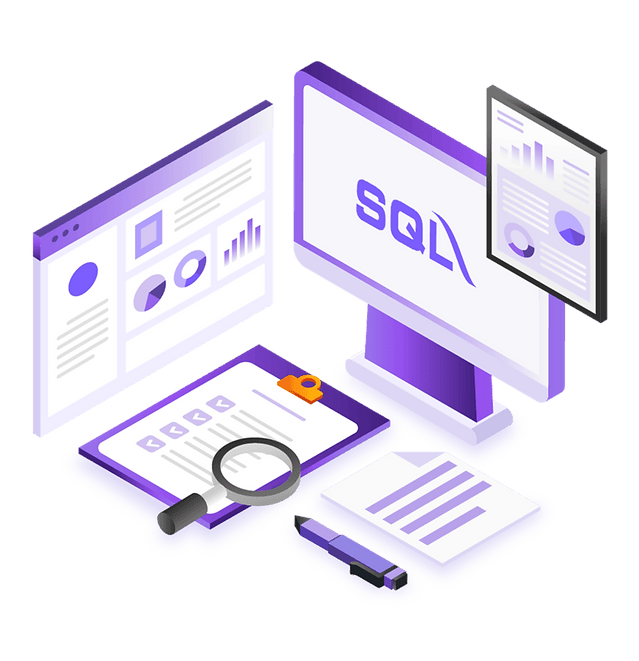
SQL Business Intelligence Dashboard is a clean, compressive, no frills feature that shows you all the necessary data that you need to monitor the performance of your business. SQL Dashboard shows your daily, weekly, annual sales, profit, cash flow, and customer retention, staff performance by contribution sales % customer collection data in one screen.

The following data can be group by sales agents to monitor agents’ performance or group by item groups to see which items are the best-selling and making the most profit.
How Can Business Intelligence Help?

Data-driven Decisions
B.I enables businesses to base decisions on accurate data rather than guesswork, leading to better outcomes.

Cost Optimization
By analyzing data, B.I helps identify cost-saving opportunities and optimize spending across various departments.

Performance Tracking
It allows monitoring key metrics and performance indicators in real-time to identify areas for improvement.

Improved Customer Experience
Understanding customer behavior through B.I helps in delivering personalized services and enhancing overall satisfaction.

Competitive Advantage
B.I provides insights into market trends and competitor activities, helping businesses stay ahead in their industry.

Forecasting and Planning
B.I tools can forecast future trends and help businesses in strategic planning and goal setting.
Cumulative & Detailed Breakdown of Sales
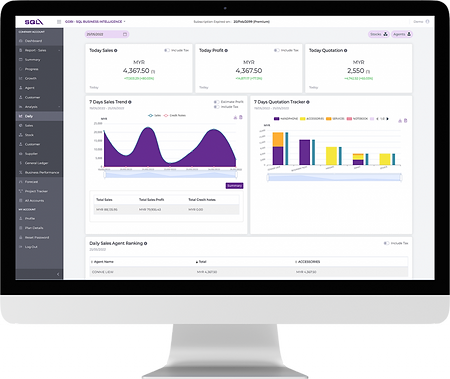
Use SQL Dashboard to get a summarized and detailed preview of all your sales data.
Review your daily business performance by studying your daily levels of sales, profits, product group performance, number of quotation documents issued, converted, pending.
SQL Dashboard also shows you the comparison between this year vs last year by sales amount or by margin, top selling products, top sales customers analysis are all available.
This is proven useful for performance monitoring and achieving short term goals.
Sales Analysis Reports
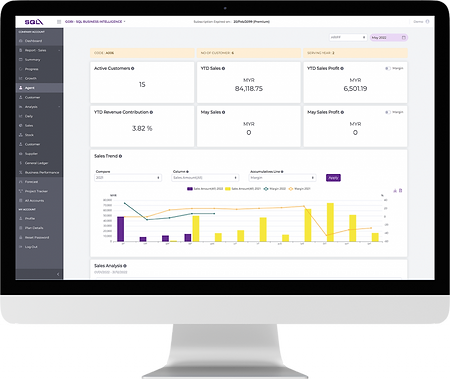
View annual sales trend with the help of SQL’s interactive bar graph. Identify the peaks and dips in your sales during the year and use that information to make better decisions that can help boost the sales of your business. The sales comparison reports can also be used as a benchmark to analyse your current performance with the past.
Evaluate Staff's Performance
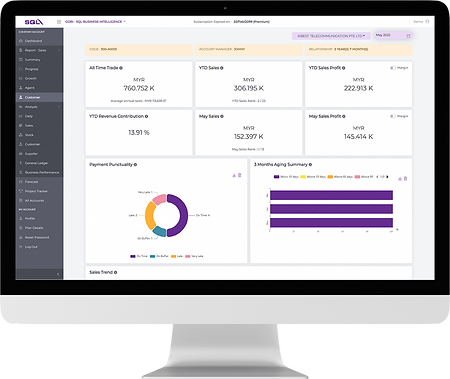
As a business owner, you want to evaluate your staff’s performance and reward your staffs accordingly. Using this dashboard, sales are grouped by sales agents and stock item group. The data is then populated into a bar graph. You can use this information to decide how staff commission will distributed.
Monitor Company's Growth
The Dashboard shows you the number of new, old and existing customers. You can track your business growth with his dashboard. Dashboard also shows you the geographical breakdown of your customers location. Knowing where your customers are coming from can help you market your products in a way that is relevant with majority of your customers.


Introduction Video

Ready to transform your business?
Get a FREE DEMO with our experts today!
📞 +6013-456 8000